Mến chào các em, trong IELTS Writing task 1, dạng bài multiple charts/graphs là dạng khó nhất. Rất nhiều bạn học sinh của cô cũng gặp vấn đề ở dạng bài này, nên hôm nay cô làm bài giảng này để hướng dẫn các em viết multiple charts/graphs sao cho CHUẨN nhé.

Multiple charts/graphs có hai dạng chính:
- Different charts/graphs
- Same charts/graphs
Ví dụ: Answer ở cuối bài.
The graph and table below give information about water use worldwide and water consumption in two different countries.
Summarize the information by selecting and reporting the main features and make comparisons where relevant.

1/ Phân tích câu hỏi:
Khi gặp dạng bài multiple chart, do không hiểu rõ yêu cầu đề bài, các em thường có xu hướng phân tích tất cả các ý mà charts/graphs đề cập. Đây thực sự là một sai lầm vì:
- Các em chỉ có tầm 15-20 phút cho task 1.
- Đề cập quá nhiều ý làm bài report dài ra dẫn đến nguy cơ mất điểm do vượt quá số chữ cho phép, bên cạnh đó nguy cơ xuất hiện các lỗi ngữ pháp, từ vựng cũng cao hơn nếu người viết chưa có khả năng kiểm soát lỗi tốt.
Đề bài thường gặp cho multiple chart có dạng: Summarize the information by selecting and reporting the main features and make comparisons where relevant.
Có thể tóm gọn lại thành: Summarize the main features and make comparison where relevant.
Nghĩa là, các em chỉ tóm tắt lại các ý chính của graphs/charts được đưa ra và chỉ so sánh ở những điểm liên quan mà thôi. Các ý phụ hoàn toàn không cần thiết. (Lưu ý: giám khảo cũng sẽ đánh giá khả năng phân tích chọn ý chính từ charts/graphs của các em đấy nhé)
Một quan niệm sai lầm khác của các em khi gặp dạng bài này đó là các em thường bỏ thời gian của mình ra để so sánh, tìm sự liên quan giữa hai charts/graphs với nhau, nhưng các em lại không biết rằng đôi khi mối liên hệ giữa hai charts/graphs không rõ ràng. Trong trường hợp ấy, các em chỉ cần so sánh các số liệu trong cùng 1 chart với nhau là đã đủ thõa mãn yêu cầu đề bài.
2/ Cấu trúc:
Đoạn 1: Introduction (1-2 câu):
Paraphrase lại nội dung chính của từng charts/graphs một cách riêng rẽ. Ví dụ: “The first bar chart shows…, while the second chart illustrates…”
Đoạn 2: Summary of main points (2-3 câu):
Trong đoạn này, các em sẽ nêu lên không nhiều hơn 2 ý chính hoặc một ý chính, một xu hướng chung cho mỗi chart/graph (không phân tích chi tiết và không kèm số liệu).
Lưu ý: Trong trường hợp mối liên hệ giữa hai charts/graphs rõ ràng và quan trọng, các em nên dành một câu để nêu lên mối quan hệ đó nữa nhé.
Body:
- Charts/graphs khác nhau (2 đoạn):
Đoạn 1: Phân tích chi tiết 2 ý đã nêu ở đoạn 2 với chart/graph 1
Đoạn 2: Phân tích chi tiết 2 ý đã nêu ở đoạn 2 với chart/graph 2
- Charts/graphs giống nhau (Ví dụ: 2 pie charts)
Với 2 charts/graphs giống nhau, bên cạnh các phân tích riêng rẽ như ở phần Charts/graphs khác nhau, các em hoàn toàn có thể phân tích chung trong cùng một đoạn văn theo dạng:
Firstly, the first charts… (phân tích chi tiết 2 ý đã nêu ở đoạn 2 với chart/graph 1). Secondly, the second charts… (phân tích chi tiết 2 ý đã nêu ở đoạn 2 với chart/graph 2).
HOẶC (trong trường hợp 2 ý của chart/graph 1 có thể so sánh với 2 ý của chart/graph 2)
Firstly, the first main point of both graphs … (so sánh chi tiết ý chính đầu của cả 2 charts/graphs). Secondly, the second main point of both graphs (so sánh chi tiết ý chính thứ 2 của cả 2 charts/graphs).
3/ Samples:
Different chart/graph
Ví dụ 1:
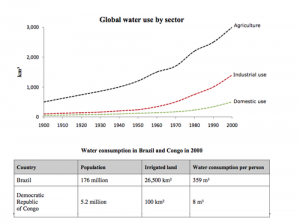
The charts compare the amount of water used for agriculture, industry and homes around the world, and water use in Brazil and the Democratic Republic of Congo.
It is clear that global water needs rose significantly between 1900 and 2000, and that agriculture accounted for the largest proportion of water used. We can also see that water consumption was considerably higher in Brazil than in the Congo.
In 1900, around 500km³ of water was used by the agriculture sector worldwide. The figures for industrial and domestic water consumption stood at around one-fifth of that amount. By 2000, global water use for agriculture had increased to around 3000km³, industrial water use had risen to just under half that amount, and domestic consumption had reached approximately 500km³.
In the year 2000, the populations of Brazil and the Congo were 176 million and 5.2 million respectively. Water consumption per person in Brazil, at 359m³, was much higher than that in the Congo, at only 8m³, and this could be explained by the fact that Brazil had 265 times more irrigated land.
(184 words, band 9)
Ví dụ 2:

The two charts depict different information related to complaints within the bank of America. The pie chart shows the sources of complaints, while the bar chart illustrates the average time taken between investigation into complaints and final action taken.
In general, by far the highest number of complaints against the bank of America originated from the public. The bar chart shows the average time period between investigation and action is around 5 months.
63% of all complaints against the bank of America are lodged by the public. Of the remaining 37% of complaints, the figures can be grouped into percentages between 11 and 8%, which are made up of government agencies, out-of-state agencies, and insurance companies. Then interestingly, media and bank employee made up and equal figure, 3% in the chart.
The bar graph shows that 2001 had the highest waiting time for complaints of medical misconduct at 6 months. Although there is a significant drop from 6 months in 2001 to 5 months in 2002, all previous and proceeding years display an average waiting period of 5 months. Despite this, over time the average waiting period is decreasing.
Same charts/graphs
Ví dụ 1:

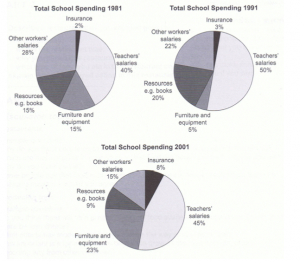
The pie charts compare the expenditure of a school in the UK in three different years over a 20-year period.
It is clear that teachers’ salaries made up the largest proportion of the school’s spending in all three years (1981, 1991 and 2001). By contrast, insurance was the smallest cost each year.
In 1981, 40% of the school’s budget went on teachers’ salaries. This figure rose to 50% in 1991 but fell again by 5% in 2001. The proportion of spending on other workers’ wages fell steadily over the 20-year period, from 28% of the budget in 1981 to only 15% in 2001.
Expenditure on insurance stood at only 2% of the total in 1981 but reached 8% in 2001. Finally, the percentages for resources and furniture/equipment fluctuated. The figure for resources was highest in 1991, at 20%, and the proportion of spending on furniture and equipment reached its peak in 2001, at 23%.
Ví dụ 2:

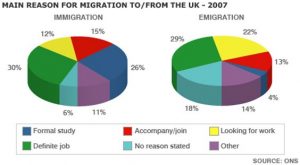
The pie charts illustrate the primary reasons that people came to and left the UK in 2007. At first glance, it is clear that the main factor influencing this decision was employment.
Having a definite job accounted for 30 per cent of immigration to the UK, and this figure was very similar for emigration, at 29%. A large number of people, 22%, also emigrated because they were looking for a job, though the proportion of immigrants for this purpose was noticeably lower at less than a fifth, 12% according to the chart.
Another major factor influencing a move to the UK was for formal study, with over a quarter of people immigrating for this reason. However, interestingly, only a very small minority of emigrants, 4%, left for this.
The proportions of those moving to join a family member were quite similar for immigration and emigration, at 15% and 13% respectively. Although a significant number of people (32%) gave ‘other’ reasons or did not give a reason why they emigrated, this accounted for only 17% with regards to immigration.
Trần Tố Linh
Giảng viên IELTS tại Bình Thạnh


